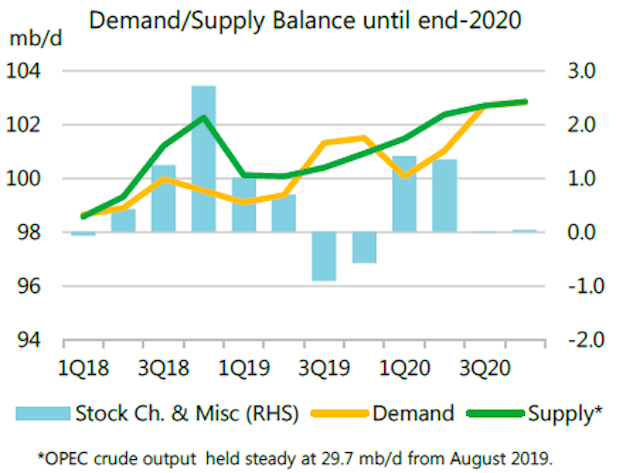
 In
its September Oil Market Report, the International Energy Agency said
that the recent halt of the relentless oil market stock builds since
early 2018 is only temporary.
According to IEA, the global oil market will tighten in this year’s second half with the call on crude from the Organization of Petroleum Exporting Countries averaging 30.5 million b/d, which is higher than current production. However, due to an expected surge in non-OPEC production at the end of this year and into 2020, the requirement for OPEC crude will plunge in the first half of 2020 to 28.3 million b/d—1.4 million b/d below what the group produced during August.
"The OPEC+ producers will once again see surging non-OPEC oil production with the implied market balance returning to a significant surplus and placing pressure on prices. The challenge of market management remains a daunting one well into 2020,” IEA said.
In August, the compliance rate of the production cut deal slipped to 116%. Three major countries—Russia, Nigeria, and Iraq—produced 600,000 b/d more than their allocations. Saudi Arabia, on the other hand, produced 600,000 b/d less than allowed, and it is clearly the lynchpin of the whole deal.
Meantime, competition for market share is getting tougher. Preliminary data show that in June, the US momentarily overtook Saudi Arabia and Russia as the world’s top gross oil exporter.
Demand
In this report, IEA left its oil demand growth forecasts unchanged from the previous report for 2019 and 2020 at a respective 1.1 million b/d and 1.3 million b/d. Crude oil prices in August were about 15-20% below the year-ago levels and this will provide support to consumption later in the year and into 2020, IEA said.
Global oil demand reached 99.9 million b/d in June, only 155,000 b/d higher than last year and the third-lowest year-on-year growth figure seen since the start of the year. Consumption fell by 510,000 b/d in the Organization for Economic Cooperation and Development and rose by 665,000 b/d in non-OECD countries. Demand was lower in Europe, Latin America, the Middle East, and India. Reduced deliveries of naphtha and fuel oil were particularly noticeable. By contrast, demand growth was robust in China (+750,000 b/d), Russia (+95,000 b/d) and in parts of Africa.
Preliminary figures for July point to stronger global demand growth of 1.3 million b/d year-over-year. There was a rebound in India (+155,000 b/d), continuing strong deliveries in Russia (+300,000 b/d) and higher demand in several other large economies. On the downside, growth in China was lower than seen recently (+300,000 b/d). Total OECD consumption rose 170,000 b/d year-over-year, with booming demand for LPG and ethane in the US a key factor.
Overall, global oil demand in this year’s first half increased by 485,000 b/d. In this year’s second half, IEA forecasts an acceleration to 1.65 million b/d, helped by a weak base of demand in second-half 2018, significantly lower oil prices from a year ago, and robust petrochemical plant additions.
On the economic fundamentals side, international trade relations have further deteriorated. Trade disputes and rising uncertainty about the impact of the UK’s possible exit from the European Union are reducing global growth. The CPB Netherlands Bureau for Economic Policy Analysis shows that the volume of world trade contracted by 0.3% year-over-year in this year’s first quarter and 0.7% in the second quarter. World industrial production growth slowed sharply, from 4.1% at the start of 2018 to 0.6% in June.
China’s exports showed decline of 1% year-over-year in August and imports lower by 5.6%. The Central Bank announced at the start of September that it was providing $125 billion more credit to banks. In US, industrial production growth has fallen steadily since its peak of 5.4% in September 2018 and was only 0.5% in July. Growth in Germany and India also appear to slow rapidly.
Supply
Thanks to a post-hurricane rebound in US, global oil supply increased by 530,000 b/d to 100.7 million b/d in August, the fourth straight month with production topping the 100 million b/d mark.
However, at 100.7 million b/d, output was down nearly 800,000 b/d on a year ago due to sharp reductions linked to sanctions and OPEC+ cuts. OPEC oil output during August was 2.4 million b/d lower than the previous year, while non-OPEC supply was up 1.6 million b/d year-over-year.
During August, the US turned in the biggest increase with supply up 520,000 b/d month-over-month. Russia and Saudi Arabia delivered combined gains of 240,000 b/d.
Following July’s 375,000 b/d monthly increase, non-OPEC oil supply rose a further 480,000 b/d in August to 65.5 million b/d. The US expansion, along with big gains from Norway and Brazil, is expected to boost non-OPEC growth from 1.9 million b/d this year to nearly 2.3 million b/d in 2020.
OPEC crude output edged up from a 5-year low to reach 29.74 million b/d in August, as Saudi Arabia pumped more, Iraq hit a new record high and Nigeria increased output.
Despite the month-over-month increase, Saudi Arabia continues to cut far more than promised under the OPEC+ pact and August marked the sixth month in a row of outperformance. The newly appointed Saudi Energy Minister Prince Abdulaziz bin Salman assured markets there would be no radical change in oil policy.
Compliance of the OPEC+ production cut deal eased to 116% during August from 130% the previous month with Iraq, Nigeria, and Russia producing 650,000 b/d above their allocations.
Refining, stocks
The recent fall in global refining activity bottomed out in July, and throughput is set to return to year-over-year growth in this year’s fourth quarter. Increased activity may depress refining margins from their current levels, which are the highest for 2019.
Preparations for the International Maritime Organization’s new fuel emission standards are likely to offer support through stronger pricing for compliant fuels. IEA believes that, overall, the IMO regulations will be introduced with relatively little disruption.
OECD commercial stocks increased by 1.5 million bbl in July to 2,931 million bbl and stood 19.7 million bbl above the 5-year average. Preliminary data for August show inventories falling in the US and Europe, while stocks increased in Japan. Floating crude oil storage rose by 7.9 million bbl in August to 66.1 million bbl due to an increase of numbers of tankers storing crude in Iran.
(Sep 12th, 2019, www.ogj.com)
